
We will look for multi time frame analysis on nifty for upcoming view
Nifty on DAILY timeframe
Forming rising wedge chart and inside bar candle pattern

NIFTY formed a Double Inside Bar on Daily Chart.

Rising channel usually breaks to the downside only. Should it break this channel along with the support level of 21850, we could see a down move of 300-400 points.
The next support level is at 21550, which is also the low from the previous month. However, it is important to wait for a clear breakdown before selling, rather than acting on anticipation. If it does not break this level within this week, the Nifty is likely to continue its slow and steady rise within this channel. For a better
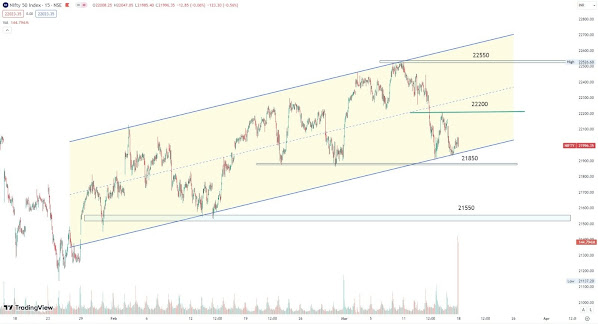


understanding, please refer to the chart below

Positional analysis on Nifty
Negative divergence on RSI and MFIVolatility divergence on Bollinger BandsMACD is sell signal, raw MACD line sloping down

On lower timeframe data ( 15mins) 22200-22500 seems to be the distribution zone. Smartest selling on 6th March 2024.
20200-20300 levels now strong resistance zone.
Any bullish view only after Nifty can close above 22500 for two consecutive days
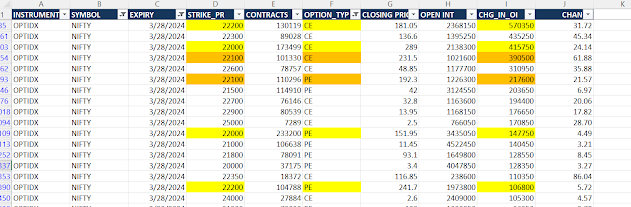
On Nifty monthly chain. 22000-22300 strikes saw OI buildup where calls sold outnumbers puts sold on this strike by a large margin, so strong bearish pressure from this zone.
22000pe now has the highest OI on the PE side on monthly strikes.
What strikes is the liquidation of the 21700pe, that's the unusual action


Nifty ....... 22023
Strong support....... 21332
Weekly chart Gap filling level support .... 20280
Just a view points,do your analysis before making any decisions


No comments:
Post a Comment