Monday, August 28, 2023

THE HISTORY OF INDIAN SENSEX

 Journey of Indian Stock Market*📈📈


*1979* - Sensex = *100*,

Sensex


*1983* - Indian Cricket Team winning World Cup. Sensex = *212*,


*1984* - *Indira Gandhi* shot dead & Bhopal Gas tragedy. Sensex = *245*,


*1989* - *Hung Parliament* with Congress outside support. Sensex = *714*,


*1991* - *Rajiv Gandhi* assassination. Sensex = *1168*,

Sensex in 40 years


*1993* - Blast in Mumbai. Also at BSE buidling. *Riots all over*. Sensex = *2281*


2001- Gujarat *earthquake*. Sensex = *3640*,


2004- UPA coming to power with Left party support. Sensex = *5591*,


*2006* - Sensex conquering = *10000*,


*2007* - Sensex conquering = *20000*,

40 years of journey of sensex


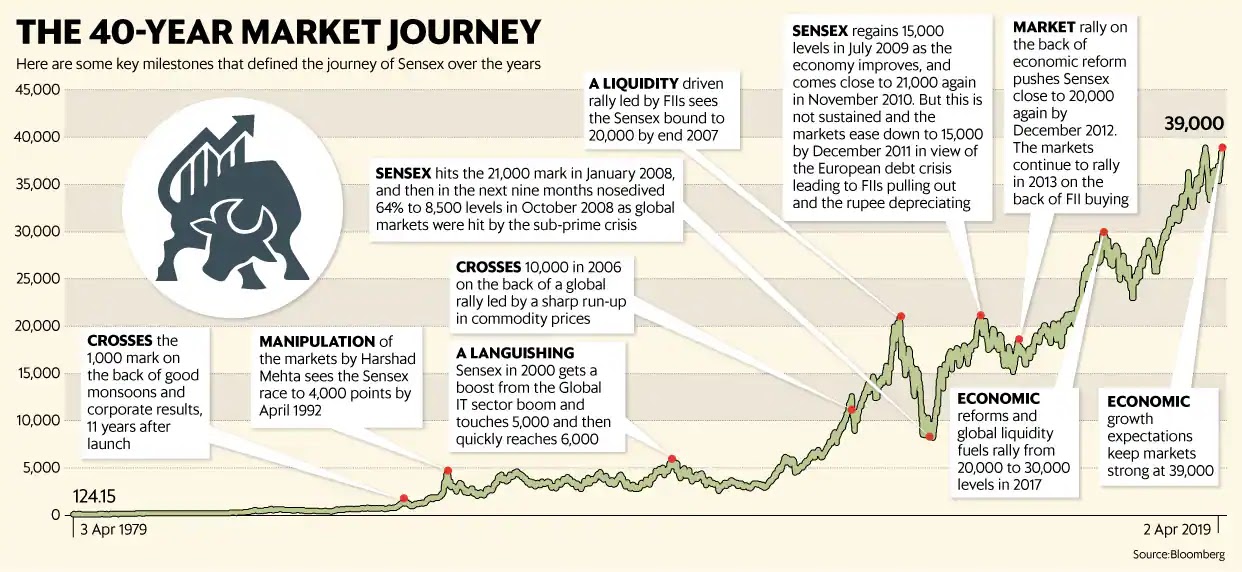
*2008* - subprime crisis

Crude oil rising upto $ 147.

Sensex below 9000


*2010* - Satyam *scam*, Common wealth scam. Sensex = *17590*,


*2013- Fed taper tantrums 


*2014* - *BJP* alone conquering *283 seats* in Lok Sabha and NDA coming to power with 330 seats. Sensex = *25000*.

Sensex after pm Modi comes in power in 2014


*04/03/2015* - Sensex = Life Time *High* *30025*..! 


2016- Demonitisation 


2018- carnage in small caps 


2020- Covid. Sensex back at 25900 on 23 march 


2022-2023 Russia Ukraine war , 525 bps rate hikes by fed


Sensex at 65000…. 650 times 


Downturns are temporary 

India story is structural 👍


Be disciplined ..

Thursday, March 23, 2023

INTRODUCTION TO TECHNICAL ANALYSIS

Technical analysis is a popular method of evaluating financial markets that involves analyzing statistical patterns in price and volume data. Traders use technical analysis to make informed decisions about when to buy or sell financial assets. Here are some important points to know about technical analysis:

Technical analysis


  1. Technical analysis is based on the idea that the price of an asset reflects all available information about the asset. This includes fundamental factors such as company earnings, as well as market psychology and investor sentiment.

  2. Technical analysts use charts and technical indicators to identify patterns in the price and volume data. These patterns can indicate the direction of the trend and potential entry and exit points for trades.

  3. There are many different types of technical indicators, including moving averages, oscillators, and trendlines. Each indicator provides a different perspective on the market and can be used to confirm or contradict other indicators.

  4. Technical analysis is not foolproof and can be subject to false signals and interpretation errors. Traders should always use technical analysis in conjunction with other forms of analysis, such as fundamental analysis and market news.


Traders using technical analysis might look for additional confirmation signals, such as oversold conditions on an oscillator indicator, before entering a long position on ABC Corp. They might also set a stop-loss order below the support level to limit potential losses in case the price continues to drop.

In conclusion, technical analysis is a valuable tool for traders to evaluate financial markets and make informed trading decisions. However, it should be used in conjunction with other forms of analysis and should not be relied upon as the sole basis for trading decisions.

Details view of market in upcoming days (18-03-2024)

  We will look for multi time frame analysis on nifty for upcoming view Nifty on DAILY timeframe Forming  rising wedge chart and inside bar ...